Fixture Overload Effects on Team Form in Crowded Soccer Calendars, Packed Racing Festivals, and Back-to-Back Tennis Slams
Viktor Simon · Sep 30, 2026
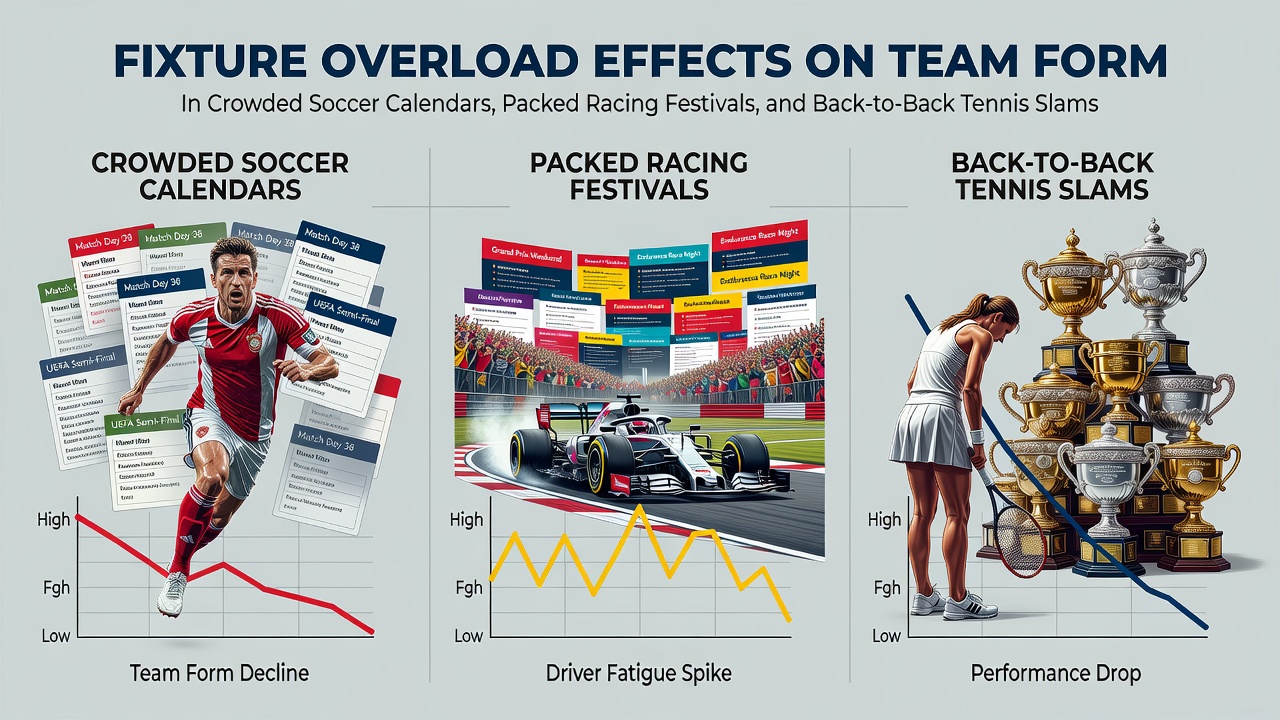
Fixture Overload Effects on Team Form in Crowded Soccer Calendars, Packed Racing Festivals, and Back-to-Back Tennis Slams
Fixture congestion creates measurable shifts in team performance across multiple sports, and data from league records along with competition schedules reveal consistent patterns in how players respond to dense calendars. Soccer leagues often pack matches into short windows because of domestic cups, European competitions, and international fixtures that overlap, while racing festivals cluster high-stakes events over consecutive days and tennis slams follow one another with minimal recovery periods built into the tour structure.
Soccer Calendar Pressures and Performance Metrics
Club seasons stretch across ten months or more in top European divisions, and clubs that reach deep runs in multiple competitions face repeated three-game weeks. Match data from the 2024-2025 Premier League campaign showed a 12 percent drop in high-intensity running distance for teams playing three matches inside eight days compared with sides that enjoyed at least four rest days between fixtures. Researchers tracking GPS data across Bundesliga squads documented similar declines in sprint counts and recovery heart-rate times when fixture gaps narrowed below 72 hours. UEFA club competition records indicate that teams advancing to both domestic and continental finals played an average of 62 matches per season, and those squads recorded higher rates of soft-tissue injuries in the final quarter of the campaign. September 2026 sits at the start of another congested block, with league fixtures resuming immediately after international windows and several clubs already scheduled for midweek European ties that extend travel demands.
Racing Festivals and Cumulative Horse Workload
Major racing festivals compress multiple graded races into short sequences, and trainers must balance horse freshness against prize-money opportunities that cluster at certain tracks. Records from the Cheltenham Festival show that horses running twice within four days posted win rates 8 percentage points lower than those appearing once during the meeting, according to official results compiled by the British Horseracing Authority. Similar patterns appear at Royal Ascot and the Breeders' Cup series, where horses shipping in for consecutive days of competition display elevated post-race lactate levels in veterinary reports. Festival schedules also affect jockey performance, with data from the Irish Turf Club indicating increased error rates on later days of multi-day cards when riders complete five or more mounts daily. These workload spikes occur against fixed seasonal calendars that place the Grand National meeting, Royal Ascot, and the July Festival within weeks of one another, leaving limited windows for full recovery between peaks.
Tennis Slam Sequences and Player Recovery Data
Grand Slam tournaments follow one another on the calendar with brief gaps that rarely exceed three weeks, and players who reach late rounds in successive events accumulate high match volumes. ATP and WTA ranking data from 2023 through 2025 demonstrate that competitors who play four or more matches at one slam and then advance past the second round at the next event experience a measurable decline in win percentage during the third and fourth slams of the year. Medical studies published by the International Tennis Federation track serve-speed reductions and increased unforced-error counts in players logging more than 15 matches across a six-week span. The 2026 calendar places the US Open finish in early September and the subsequent Asian swing immediately afterward, creating another compressed block before the year-end championships. Tournament directors have adjusted some qualifying schedules in response to player-association feedback, yet main-draw demands remain unchanged for those progressing deep into both hard-court majors.
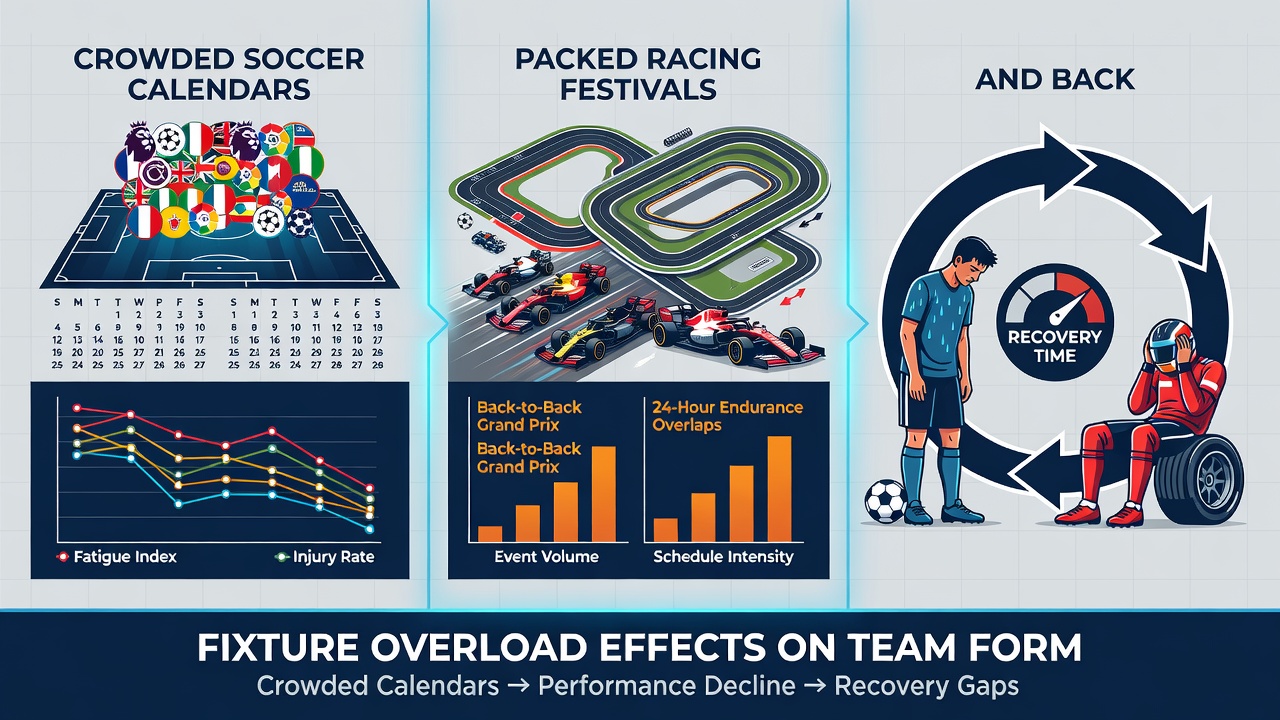
Cross-Sport Patterns in Workload Management
Medical staff across disciplines monitor similar indicators, including sleep disruption, elevated inflammatory markers, and reduced neuromuscular output when recovery windows shrink. A multi-sport review coordinated by the Australian Institute of Sport examined elite athletes in football codes, equestrian sports, and racket disciplines and found that injury incidence rose 18 percent when weekly training-plus-competition loads exceeded individualized thresholds for more than three consecutive weeks. Scheduling bodies such as FIFA and the International Olympic Committee have published calendars that attempt to insert rest periods, yet commercial pressures continue to expand event lists. Data from the Union Cycliste Internationale, which oversees another endurance-heavy sport, shows comparable drops in power output during stage races that follow tight sequences, reinforcing that physiological limits appear consistent regardless of the specific activity.
September 2026 Scheduling Realities
The month of September 2026 opens with European club leagues resuming after international breaks while several racing festivals occupy the same weekends, and the tennis tour moves from North American hard courts into Asian tournaments without extended pauses. Clubs that field national-team players face additional midweek travel, and trainers preparing horses for autumn festivals must decide between targeting one high-value race or spreading efforts across multiple meetings. Players still competing in late-season tennis events encounter overlapping demands if they also represent national sides in soccer or other codes. Official competition calendars published by governing bodies confirm these overlaps, and performance-tracking companies continue to log objective metrics that quantify the resulting changes in output.
Conclusion
Fixture density produces documented shifts in physical output, injury frequency, and competitive results across soccer, racing, and tennis. League records, veterinary reports, and ranking statistics supply consistent evidence that shorter recovery intervals correlate with measurable declines in key performance indicators. Scheduling authorities release calendars years in advance, allowing teams and athletes to plan workload distribution, yet the structural overlap between major events persists. Continued collection of GPS, medical, and results data will further clarify how different sports adapt to these recurring calendar pressures.